Study designs that involve making two observations on the same individual, or one observation on each of the two similar individuals, yield paired data. When paired data result from measuring the same quantitative variable twice, we can make comparisons by analyzing the differences in each pair. If the conditions for inference are met, we can use one sample t procedure to perform inferences about the main difference μ. These methods are sometimes called paired t procedures.
We compare the populations or treatments by doing inference about the difference p1 - p2 between the parameters. The statistic that estimates this difference is the difference between the two sample proportions p̂1-p̂2. To use p̂1-p̂2 for inference, we must know its sampling distribution.
The sampling distribution of a sample proportion p̂ has the following properties: Shape: Approximately normal if np ≥ 10 & n(1-p) ≥ 10 Center: μp̂ = p Spread: σp̂ = √((p(1-p))/n) if n ≤ (1/10)N
For the sampling distributions of p̂1 and p̂2 where n=100 and p=0.7:
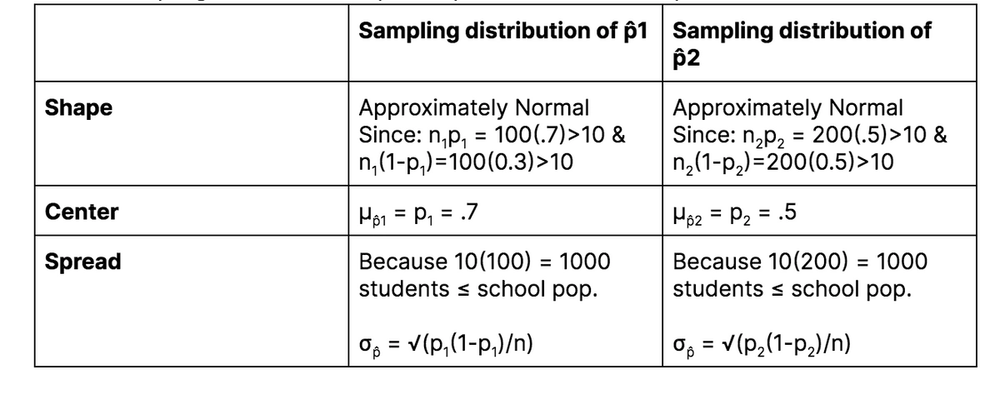
Shape: approximately normal Center: about .198 (p1-p2 = .2) Spread: about .0572 (√(σp̂12 +σp̂22))
Conditions for constructing a confidence interval about a difference in proportions: Random: The data come from two independent random samples 10%: When sampling without replacement, check that n1 < (1/10)N1 and n2 < (1/10)N2 Large Counts: The counts of “successes” and “failures” in each sample or group–– n1p1, n1(1-p1), n2p2, n2(1-p2)––are all at least 20
When using a calculator, the confidence interval for p1-p2 = STAT -> TESTS -> 2-PropZInt
Practice Significance test for p1-p2 structure: P: Significance Tests for p1-p2
H: Ho: p1-p2 = 0 or Ho: p1 = p2
A: Conditions for performing test Random 10% Large Counts (at least 10)
N: Paired t test for difference in population proportions
T: Statistic ± critical value * standard deviation of statistic z = (p̂1-p̂2)-0/√(standard deviation of statistic)
O: Find p-value
M: Interpret p-value in context
Congratulations on completing your AP Statistics course! Stats is a course that has an enormous amount of real world application, so we hope you’ve gained some important skills on the way. To leave you with some parting tips, always remember to graph your data, label your axis, and finish your problem with context. Remember: data is just numbers until you give it a purpose.